Visustin 7 Details
Shareware 5.03 MB
Visualize your source code with flow charts and UML Activity Diagrams. Open your modules in Visustin to flowchart them automatically. Visualize complex functions. View and print flow charts. Turn your code into Visio flow diagrams. Visustin supports 43 popular programming languages.
Publisher Description
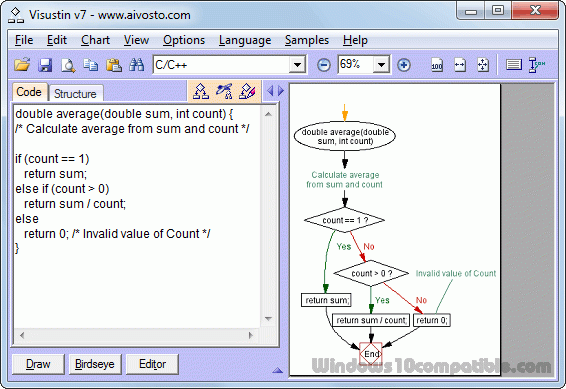
 Visustin is a flow chart generator for software developers. Convert your source code to flow charts or UML Activity Diagrams automatically.
An optimized layout engine draws a flow chart of even your most complex functions and classes. Visustin reverse engineers your source code to visualize program logic: conditional statements, loops and jumps. Use automatic charts or draw your own.
Understand complex routines. Review algorithms. Verify program logic. Restructure bad code. Create code documentation automatically. With Visustin you create PDF flow charts or print them to hang on your wall. You can save flow charts in any common image format, such as GIF. You can also create Visio diagrams automatically from source code, or export flow charts to Word and PowerPoint.
Visustin flowcharts 43 programming languages: ABAP, ActionScript, Ada, ASP, assembler, BASIC, Batch files, C, C++, C#, Clipper, COBOL, ColdFusion, Delphi, Fortran, Java, JavaScript, JCL, JSP, LotusScript, Matlab, MXML, Pascal, Perl, PHP, PL/I, PL/SQL, PowerBuilder PowerScript, PureBasic, Python, QuickBASIC, REALbasic, Rexx, Ruby, SAS, T-SQL, Unix shell script (bash, csh, tcsh, ksh, sh), VB, VBA, VBScript, VB.NET, Visual FoxPro and XSLT.
Visustin is a flow chart generator for software developers. Convert your source code to flow charts or UML Activity Diagrams automatically.
An optimized layout engine draws a flow chart of even your most complex functions and classes. Visustin reverse engineers your source code to visualize program logic: conditional statements, loops and jumps. Use automatic charts or draw your own.
Understand complex routines. Review algorithms. Verify program logic. Restructure bad code. Create code documentation automatically. With Visustin you create PDF flow charts or print them to hang on your wall. You can save flow charts in any common image format, such as GIF. You can also create Visio diagrams automatically from source code, or export flow charts to Word and PowerPoint.
Visustin flowcharts 43 programming languages: ABAP, ActionScript, Ada, ASP, assembler, BASIC, Batch files, C, C++, C#, Clipper, COBOL, ColdFusion, Delphi, Fortran, Java, JavaScript, JCL, JSP, LotusScript, Matlab, MXML, Pascal, Perl, PHP, PL/I, PL/SQL, PowerBuilder PowerScript, PureBasic, Python, QuickBASIC, REALbasic, Rexx, Ruby, SAS, T-SQL, Unix shell script (bash, csh, tcsh, ksh, sh), VB, VBA, VBScript, VB.NET, Visual FoxPro and XSLT.
Download and use it now: Visustin
Related Programs
Diagonal Flow
The re-invented flow puzzle! In this flow puzzle you have to use diagonal lines to connect all points with the same color. Don't break the flow by crossing lines with different color and fill all cells. The download of this...
- Freeware
- 20 Jul 2015
- 6.51 MB
Daily Cash flow Statement spreadsheet
It is a task-oriented Excel spreadsheet that already has the necessary and appropriate formulas programmed in and professional-looking formats laid out for you. You choose the starting year, you enter your initial amount of your money and then you enter...
- Shareware
- 31 Jul 2019
- 464 KB
TMS FNC Chart
- Highly configurable cross-platform chart. - Support for VCL Win32/Win64, FMX Win32/Win64, MacOS-X, iOS, Android, LCL Win32/Win64, Mac OS-X, iOS, Android, numerous Linux variants including Raspbian - Support for multiple series with optional separate or combined auto range for x-...
- Shareware
- 25 Feb 2016
- 8.49 MB
NOV Chart for .NET
NOV Chart for .NET is an advanced charting control for .NET, covering a vast feature set of charting types for presentational, business, scientific, financial, real-time monitoring, statistical and other types of applications. NOV Chart for .NET enables developers to create...
- Shareware
- 21 Aug 2016
- 307.34 MB
Nevron Chart for .NET
Nevron Chart for .NET is designed to be flexible, efficient and extensible. Combining a vast amount of features in an intuitive and straightforward programming model, the component can display virtually any 2D or 3D chart including: Bar, Line, Step Line,...
- Shareware
- 20 Jul 2015
- 226.61 MB